

General Motors (GM) stock is back in focus after the company asked to be removed as a partner from a Lansing battery plant project with LG Energy Solution, in an effort to better align its commitments with current EV demand.
See our latest analysis for General Motors.
For context, General Motors’ share price has eased over the past week, with a 7 day share price return of 6.31% and a 1 day decline of 0.78%. However, the 30 day share price return of 10.04% and a 1 year total shareholder return of 48.05% suggest momentum has largely been positive, as investors weigh strong recent earnings against shifting EV commitments, extended partnerships in China and continued investment in charging infrastructure.
If GM’s recent moves around EV batteries and charging have your attention, this could be a good moment to broaden your watchlist with other electrification plays such as grid technology, transmission and related infrastructure companies through the 39 power grid technology and infrastructure stocks
General Motors is reshaping its EV commitments while the stock trades near recent highs. Does that combination favor stepping in at today’s price, or does it suggest waiting for a pullback before deciding the stock’s valuation looks attractive enough?
Most Popular Narrative: 28.3% Overvalued
At a last close of $83.71, the most followed narrative for General Motors pegs fair value closer to the mid $60s, which creates a clear gap investors need to understand.
The assumed bearish price target for General Motors is $65.23, which represents up to two standard deviations below the consensus price target of $95.85. This valuation is based on what can be assumed as the expectations of General Motors’s future earnings growth, profit margins and other risk factors from analysts on the more bearish end of the spectrum.
Want to see why a company with expected earnings growth, margin expansion and buybacks still lands on an overvalued tag? The key assumption mix behind that $65 fair value may surprise you.
Have a read of the narrative in full and understand what’s behind the forecasts.
However, if General Motors gains share in key markets or grows higher margin software and services, bearish assumptions on long term earnings concentration could appear too harsh.
Find out about the key risks to this General Motors narrative.
Another View: General Motors Through The Cash Flow Lens
The bearish narrative frames General Motors as about 28.3% overvalued at $83.71 based on analyst targets and multiples. Our DCF model tells a different story. It suggests the stock trades about 38.8% below an estimated future cash flow value of $136.74, which casts current pricing in a very different light.
That split between analyst targets and a cash flow based view raises a practical question for you. Which set of assumptions about GM’s future cash generation feels more realistic over the next cycle, and how comfortable are you if the market leans toward the other side of that debate.
Look into how the SWS DCF model arrives at its fair value.
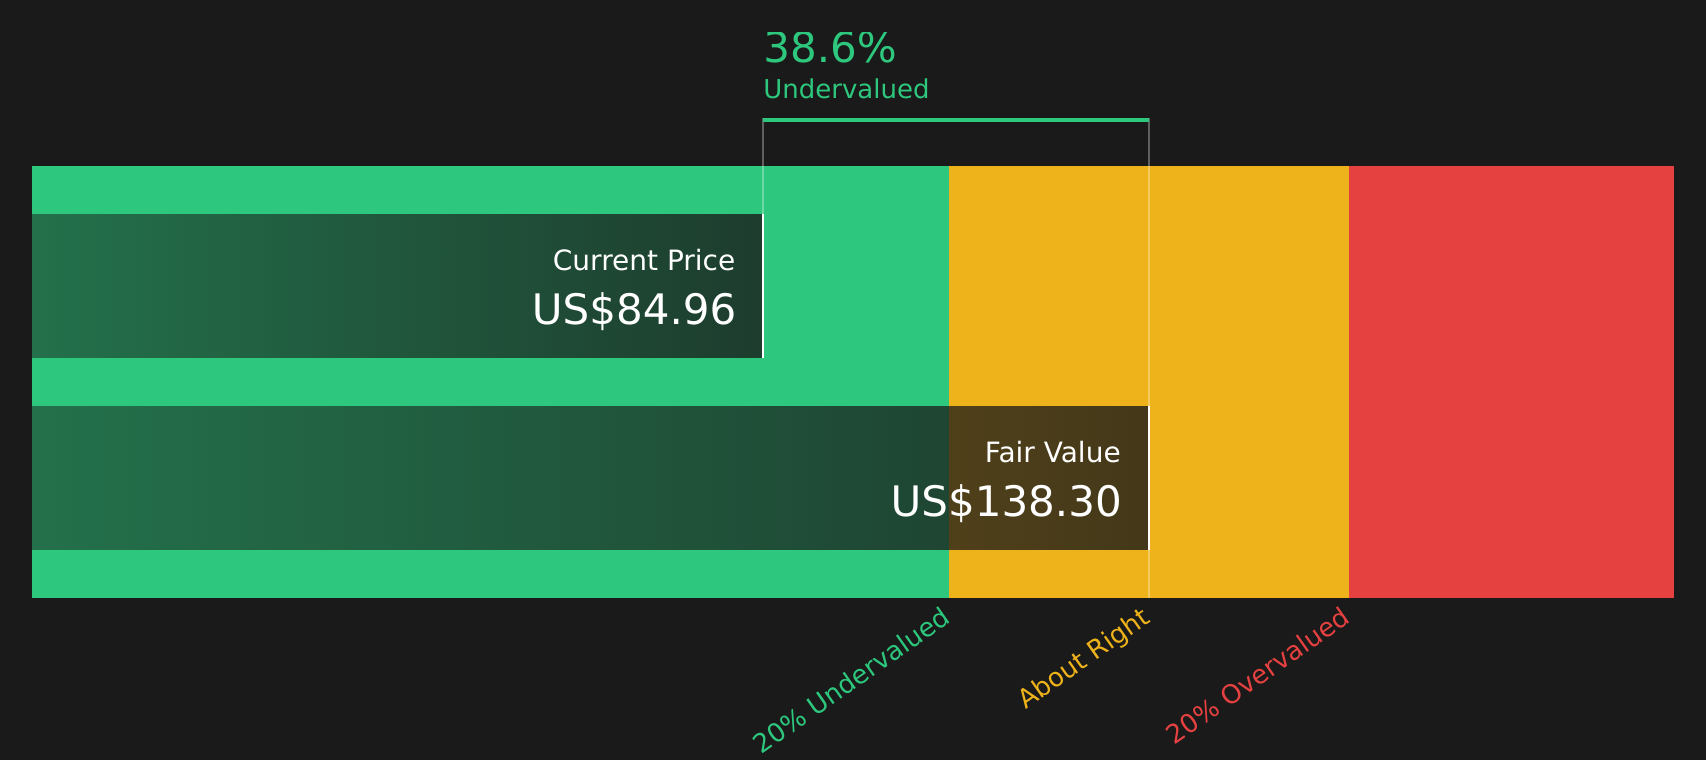
Simply Wall St performs a discounted cash flow (DCF) on every stock in the world every day (check out General Motors for example). We show the entire calculation in full. You can track the result in your watchlist or portfolio and be alerted when this changes, or use our stock screener to discover 50 high quality undervalued stocks. If you save a screener we even alert you when new companies match – so you never miss a potential opportunity.
Next Steps
With mixed signals around General Motors in this article, it makes sense to move quickly and review both sides of the data yourself through the 2 key rewards and 4 important warning signs.
Looking for more investment ideas beyond General Motors?
If you are weighing what General Motors means for your portfolio, now is a smart time to scan for other opportunities before the next move catches you off guard.
This article by Simply Wall St is general in nature. We provide commentary based on historical data
and analyst forecasts only using an unbiased methodology and our articles are not intended to be financial advice. It does not constitute a recommendation to buy or sell any stock, and does not take account of your objectives, or your
financial situation. We aim to bring you long-term focused analysis driven by fundamental data.
Note that our analysis may not factor in the latest price-sensitive company announcements or qualitative material.
Simply Wall St has no position in any stocks mentioned.
New: Manage All Your Stock Portfolios in One Place
We’ve created the ultimate portfolio companion for stock investors, and it’s free.
• Connect an unlimited number of Portfolios and see your total in one currency
• Be alerted to new Warning Signs or Risks via email or mobile
• Track the Fair Value of your stocks
Have feedback on this article? Concerned about the content? Get in touch with us directly. Alternatively, email editorial-team@simplywallst.com
