Did you get married on August 28?
If the answer’s ‘yes’, you have the most common anniversary, according to official statistics.
MailOnline analysis reveals that, on average, 1,451 couples tie the knot on that day every year.
Olympian swimmer Rebecca Adlington, writer Salman Rushdie and actress Cathy Moriarty are among those to have got married on August 28.
Our new tool – built with Office for National Statistics (ONS) data – reveals exactly how your anniversary ranks in terms of popularity.
It counts every wedding registered between 1999 and 2022 in England and Wales, including same-sex and opposite-sex marriages.
Perhaps unsurprisingly, Christmas Day was the least popular wedding date.
On average, five people get married on December 25 each year.

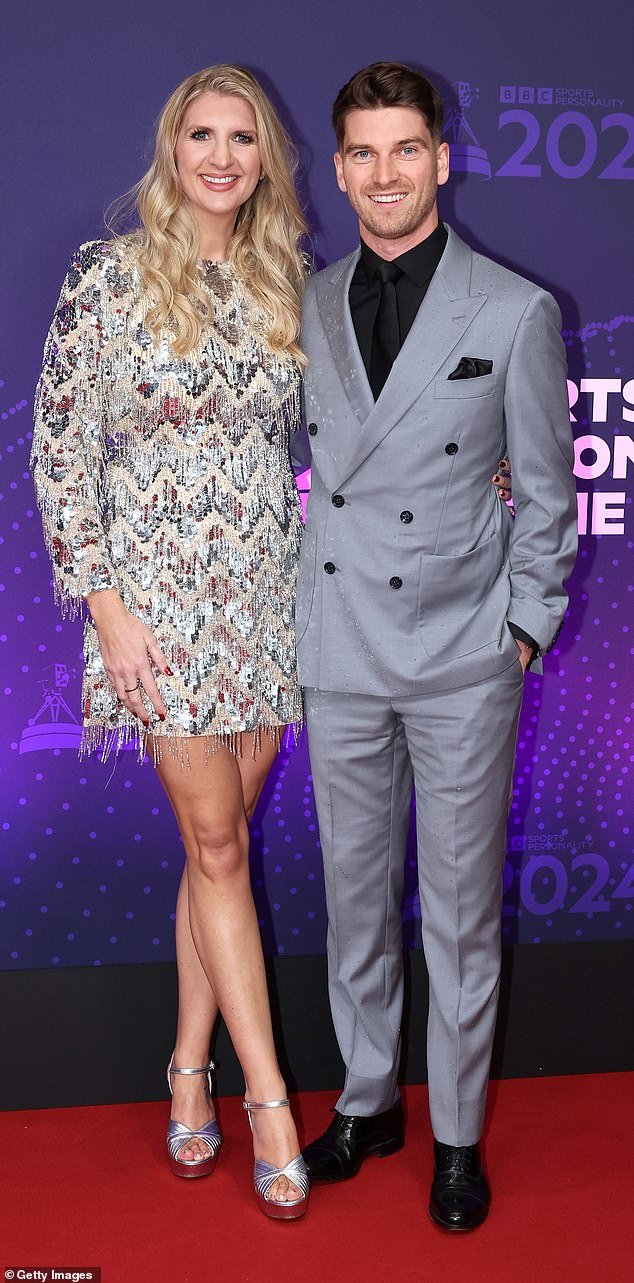
Rebecca Adlington married her second husband Andy Parsons (pictured together in 2024) in 2021 on the most popular day to get married – August 28

Salman Rushdie married his third wife Elizabeth West on August 28 in 1997 (pictured together fours years after their divorce in 2008)
The Church of England says there are ‘no legal restrictions for getting married on special days, like those around Easter, Christmas and other Bank Holidays’.
After Christmas Day, Boxing Day itself is the next least common wedding date (22), followed by New Year’s Day (36) and then January 13 (131).
February 29, however, sits next on the list (131), despite only coming around once every four years.
During 2022, the most recent year ONS data exists for, there were almost 247,000 marriages.
For comparison, more than 400,000 were happening every year in the early 1970s.
Due to the Covid lockdown in 2020, between the end of March and start of July, when the most stringent stay at home order was in place, just 264 marriages took place – compared with 71,883 the previous year.
Despite the turbulent numbers in recent years, the most and least popular days of the week have remained relatively consistent.
The most popular day of the week in 2022 was on a Saturday (107,543), followed by Friday (44,813), Thursday (27,005), Wednesday (18,481), Tuesday (17,461), Monday (17,020). Sunday was the least popular (14,574).
Saturday weddings prove popular due to the unique benefit of having more guests able to attend during the day because of work committments.
For the same reason, there is typically no need for them to leave early for work the next day – meaning the reception can continue late into the night.

Saturday remains the most popular day to get married, but it’s domination has fallen since 1999

Cathy Moriarty, who starred alongside Robert De Niro in Raging Bull in 1980, also got married on August 28
But although they are still the most popular day to tie the knot, the rate of weddings taking place on Saturdays has fallen in recent years.
MailOnline analysis shows in 1999, 66 per cent of all marriages took place on a Saturday, but this fell to just 43 per cent in 2022.
Experts believe the changing consumer behaviour is due to attempts by couples to keep costs down, as well as more people having second and third marriages which tend to be more low key.
Figures include same-sex marriages from March 2014, when the Same Sex Couples Act came into effect.
Digging down further into the data, there is one winter date that is located up nearer the top of the table – Valentine’s Day.
It seems people want to lean into the date’s romantic history to make an exception in the long-running the trend of avoiding a winter wedding.
The date averaged 1,031 weddings, meaning it was 60th out of all 366 days.
Superstitions also played a role, with the average number of weddings falling on ‘unlucky’ Friday 13th and spiking on days seen as lucky, such as November 11, 2011 (displayed in the calendar as 11/11/11).
But by far the biggest takeaway of the data is that summer still dominates the most popular wedding days.
Later in the summer, specifically August and bleeding into the first month of autumn in September proved very fashionable.

Summer remains the most popular period to get married as the longer period of daylight allows the day to last longer, as well as allowing the bride and groom to make the most out of the golden hour for stunning photos

Weddings in summer also have the advantage of allowing outdoor spaces to be used
September 1 was the second-most popular day to tie the knot – with an average of 1,445 marriages on this day during the 23-year period.
It seems the longer period of sun allows the day to last longer, as well as allowing the bride and groom to make the most out of the golden hour for stunning photos.
Popular colour schemes and vibrant themes are also more popular in the summer as they are more easy to pull off bright flowers and upbeat decorations.
Although due to the cost of living crisis of the last few years, some budding brides and grooms have avoided the more expensive dates in the peak of summer to offset costs.
And although they are the most unpopular days to be married, Christmas Day, Boxing Day and New Year’s Day also prove the most expensive, experts warn.
Staff may be paid double or triple rates as they are already a popular dates in the hospitality industry, which means it might also be difficult to secure a venue as they will all be booked in advance.
Brides and grooms choosing these dates may also have a few guests with sore heads from the night before.
But although New Year’s Day came third in the least popularity tables with an average of only 36 wedding, there was an interesting change in the year 2000.
Couples seemed keen to start the new millenium memorably as the number of weddings shot up to 249 for that year.