

- If you are wondering whether General Motors at US$84.12 is still reasonably priced after a strong run, the starting point is understanding what you are actually paying for today.
- The stock has returned 10.5% over the last 7 days, 7.9% over the past month, 3.9% year to date and 76.6% over the last year, with a 167.8% return over 3 years and 46.5% over 5 years.
- Recent coverage around General Motors has focused on how investors are reassessing established automakers in light of shifts in electric vehicle adoption, capital allocation decisions and product mix. This context helps frame why the stock’s strong multi year returns are now prompting closer scrutiny of what constitutes a fair price.
- On Simply Wall St’s 6 point valuation checklist, General Motors scores 3 out of 6. It is therefore worth comparing what different valuation methods suggest the stock is worth, and then looking at a more complete way to judge value that brings these pieces together.
Approach 1: General Motors Discounted Cash Flow (DCF) Analysis
A Discounted Cash Flow, or DCF, model estimates what a stock could be worth by projecting future cash flows and then discounting them back to what those cash flows might be worth in today’s dollars.
For General Motors, the model used is a 2 Stage Free Cash Flow to Equity approach. The company is currently generating trailing twelve month free cash flow of about $13.59b. Analyst based projections and Simply Wall St extrapolations point to free cash flow of $10.14b in 2026 and $11.71b by 2028, with further estimates extending out to 2035 in the $11b to $13b range.
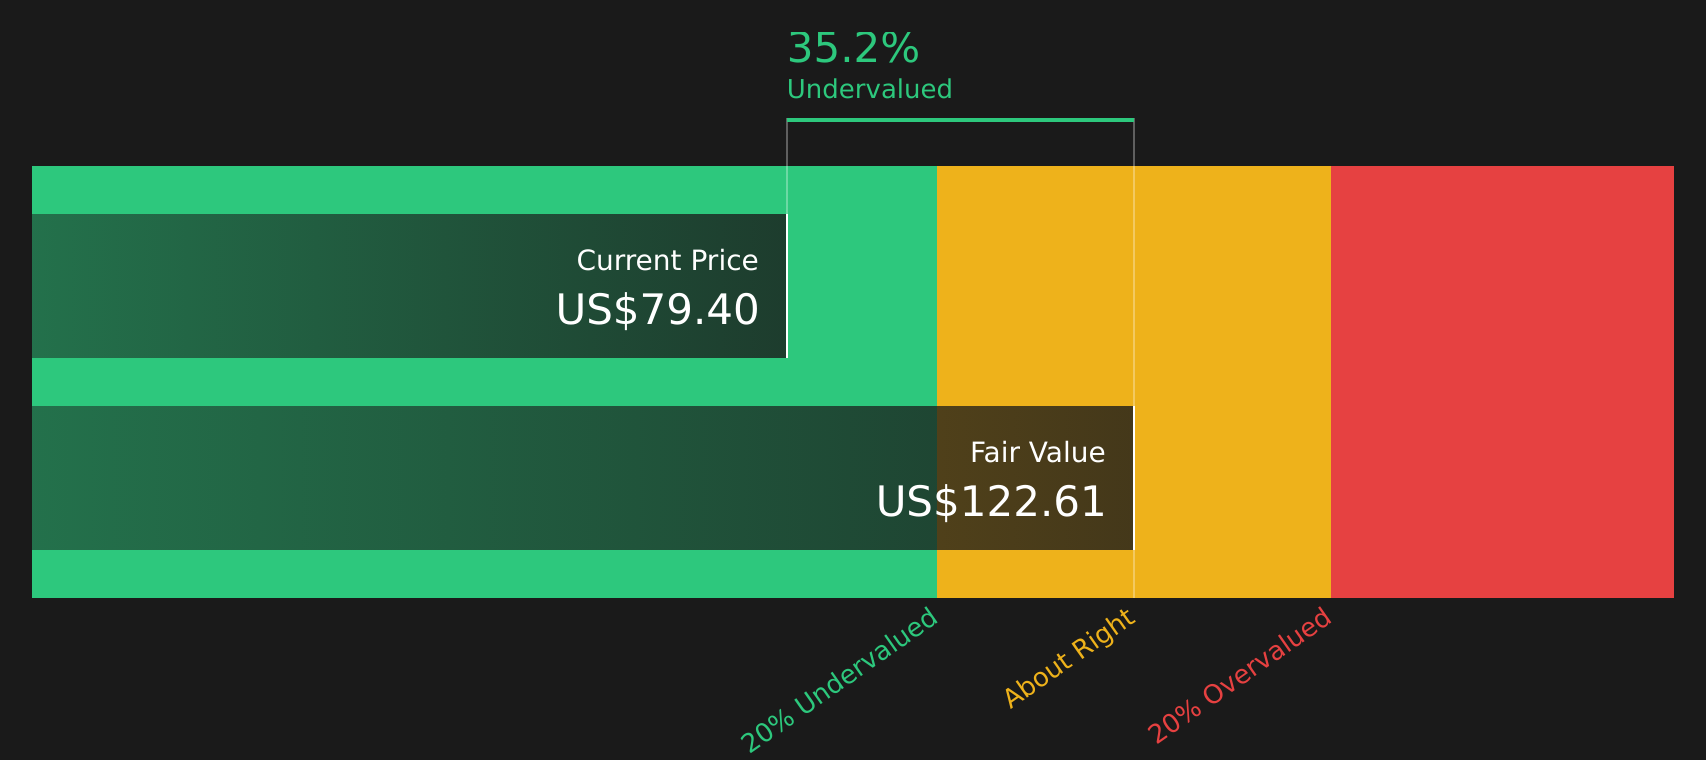
When all these projected cash flows are discounted back using the DCF model, the estimated intrinsic value is $122.61 per share. Compared with the current share price of $84.12, this implies the stock is trading at a 31.4% discount to that DCF estimate, which suggests a meaningful valuation gap on this metric.
Result: UNDERVALUED
Our Discounted Cash Flow (DCF) analysis suggests General Motors is undervalued by 31.4%. Track this in your watchlist or portfolio, or discover 47 more high quality undervalued stocks.
Approach 2: General Motors Price vs Earnings
For a profitable company like General Motors, the P/E ratio is a useful way to relate what you pay per share to the earnings the company generates. Investors typically accept higher P/E ratios when they expect stronger growth or see less risk, while slower growth or higher uncertainty usually supports a lower, more conservative multiple.
General Motors currently trades on a P/E of 31.17x. That is above the Auto industry average of 16.91x, and below the peer group average of 42.82x. Simply Wall St also calculates a “Fair Ratio” of 30.67x, which is the P/E level suggested by factors such as General Motors’ earnings profile, industry, profit margins, market value and risk characteristics.
This Fair Ratio is more tailored than a simple comparison with peers or the broad industry, because it adjusts for company specific traits instead of assuming one size fits all. With General Motors’ current P/E of 31.17x sitting very close to the Fair Ratio of 30.67x, the stock looks roughly in line with what this framework suggests.
Result: ABOUT RIGHT

P/E ratios tell one story, but what if the real opportunity lies elsewhere? Start investing in legacies, not executives. Discover our 20 top founder-led companies.
Upgrade Your Decision Making: Choose your General Motors Narrative
Earlier it was mentioned that there is an even better way to understand valuation, so Narratives are introduced here as a simple tool that lets you attach your story about General Motors to the numbers by linking your assumptions for fair value, future revenue, earnings and margins to a clear forecast and valuation that you can compare directly with the current price.
On Simply Wall St’s Community page, Narratives are accessible templates that turn this story into a structured model. They then keep it updated when fresh information such as news or earnings is added, so you can see at a glance whether your Fair Value still looks higher or lower than where the stock trades today.
For General Motors, one Narrative on the platform anchors to a Fair Value around US$41.79 with assumptions like a 13% discount rate, profit margin near 3.4%, revenue growth of 1.64% and a future P/E of 7.71x. Another sits closer to US$119.99 using a 12.33% discount rate, profit margin near 8.43%, revenue growth of 2.59% and a future P/E of 7.59x. This range shows how different investors can look at the same company and reach very different but clearly defined views.
For General Motors, here are previews of two leading General Motors Narratives that make it easier to compare different perspectives:
Fair Value in this Narrative: US$93.92 per share
Current Price vs this Fair Value: trading about 10.4% below the narrative fair value based on US$84.12.
Revenue Growth Assumption: 1.91% a year
- Analysts in this Narrative expect modest revenue growth with profit margins rising from low single digits as trucks, SUVs and software related services play a bigger role in earnings.
- They factor in continued spending on EVs, batteries and U.S. manufacturing alongside buybacks and dividends, with the view that these outlays still support higher earnings and earnings per share over time.
- The fair value hinges on GM reaching about US$195.4b of revenue and US$10.9b of earnings by around 2029 and then trading on a P/E of 9.4x, which is lower than the current industry P/E used in the Narrative.
Fair Value in this Narrative: US$41.79 per share
Current Price vs this Fair Value: trading about 101.3% above the narrative fair value based on US$84.12.
Revenue Growth Assumption: 1.64% a year
- This Narrative stresses that GM may face years of heavy EV investment before seeing meaningful returns while dealing with manufacturing, cost and organizational challenges.
- It assumes that P/E and profitability could lag other auto stocks, with profit margins under pressure even if revenue holds up or edges higher.
- The fair value reflects concern that near term margins could fall as GM balances EV spending, product decisions and broader cost pressures.
Putting these side by side shows a clear range of what different investors think GM is worth and why. It also highlights the revenue, margin and P/E assumptions you would be aligning with if you leaned toward either view.
To take the next step, you can move from these previews to the full community Narratives, compare the inputs with your own expectations for GM’s trucks, SUVs and EVs, and decide which story, if any, aligns with how you see the stock.
See what the community is saying about General Motors
Do you think there’s more to the story for General Motors? Head over to our Community to see what others are saying!

This article by Simply Wall St is general in nature. We provide commentary based on historical data
and analyst forecasts only using an unbiased methodology and our articles are not intended to be financial advice. It does not constitute a recommendation to buy or sell any stock, and does not take account of your objectives, or your
financial situation. We aim to bring you long-term focused analysis driven by fundamental data.
Note that our analysis may not factor in the latest price-sensitive company announcements or qualitative material.
Simply Wall St has no position in any stocks mentioned.
New: Manage All Your Stock Portfolios in One Place
We’ve created the ultimate portfolio companion for stock investors, and it’s free.
• Connect an unlimited number of Portfolios and see your total in one currency
• Be alerted to new Warning Signs or Risks via email or mobile
• Track the Fair Value of your stocks
Have feedback on this article? Concerned about the content? Get in touch with us directly. Alternatively, email editorial-team@simplywallst.com
