

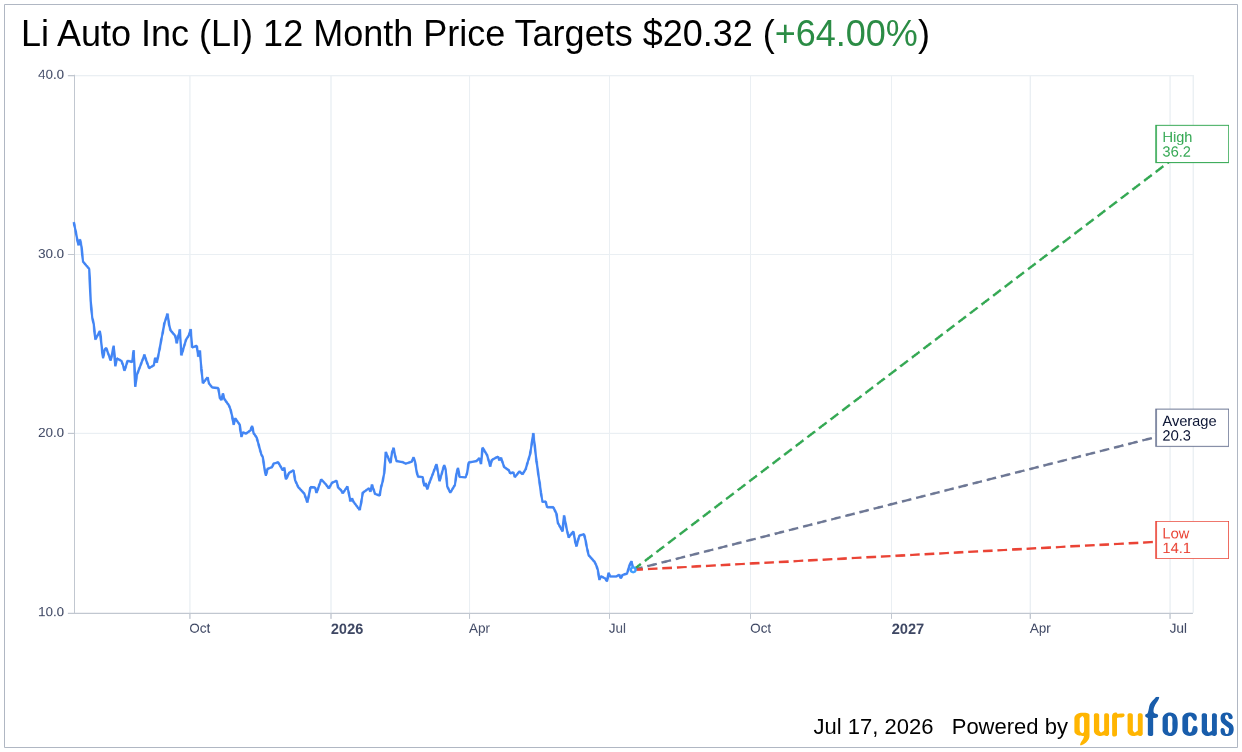
On July 17, 2026, Li Auto Inc LI shares fell 3.7%, currently priced at $12.39. The stock has experienced a 52-week range between $11.65 and $32.03, reflecting significant volatility over the past year.
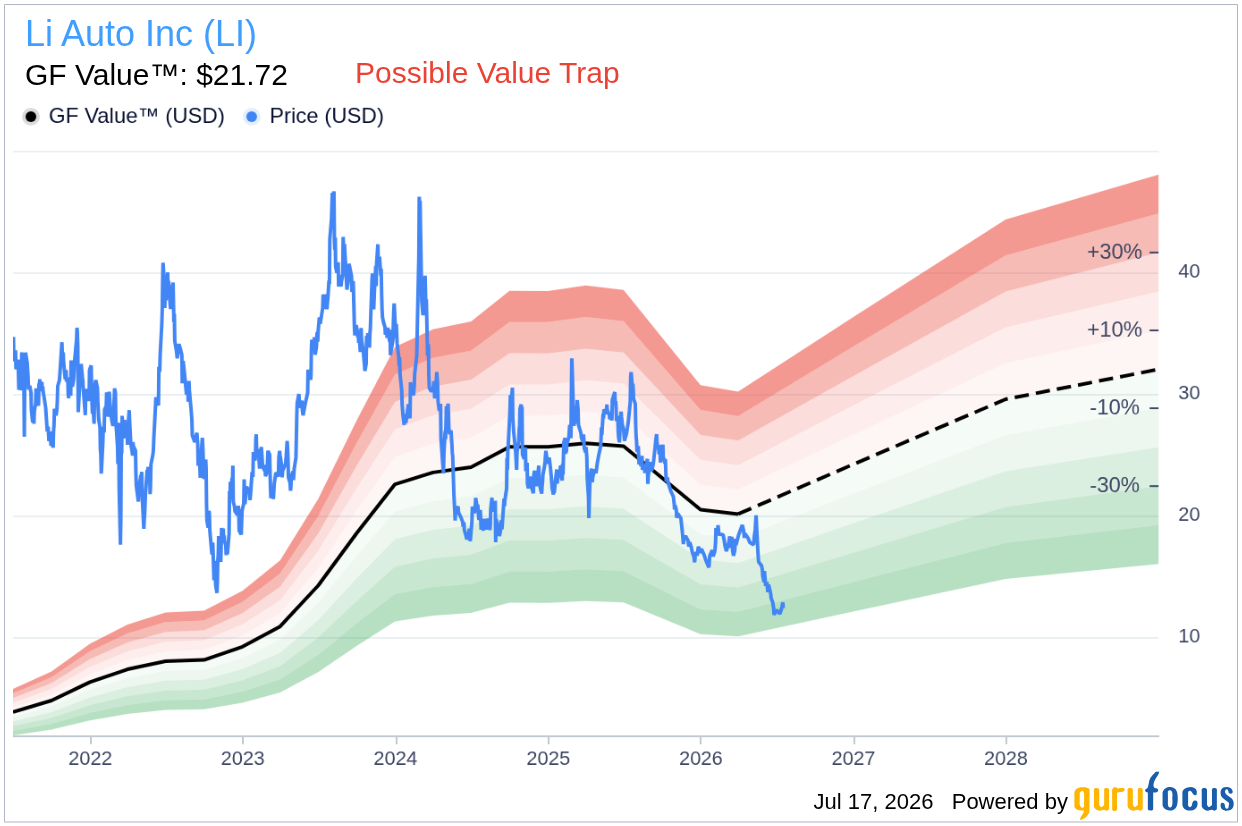
- GF Value™ verdict: The current price of $12.39 is 43.0% below the GF Value™ estimate of $21.72.
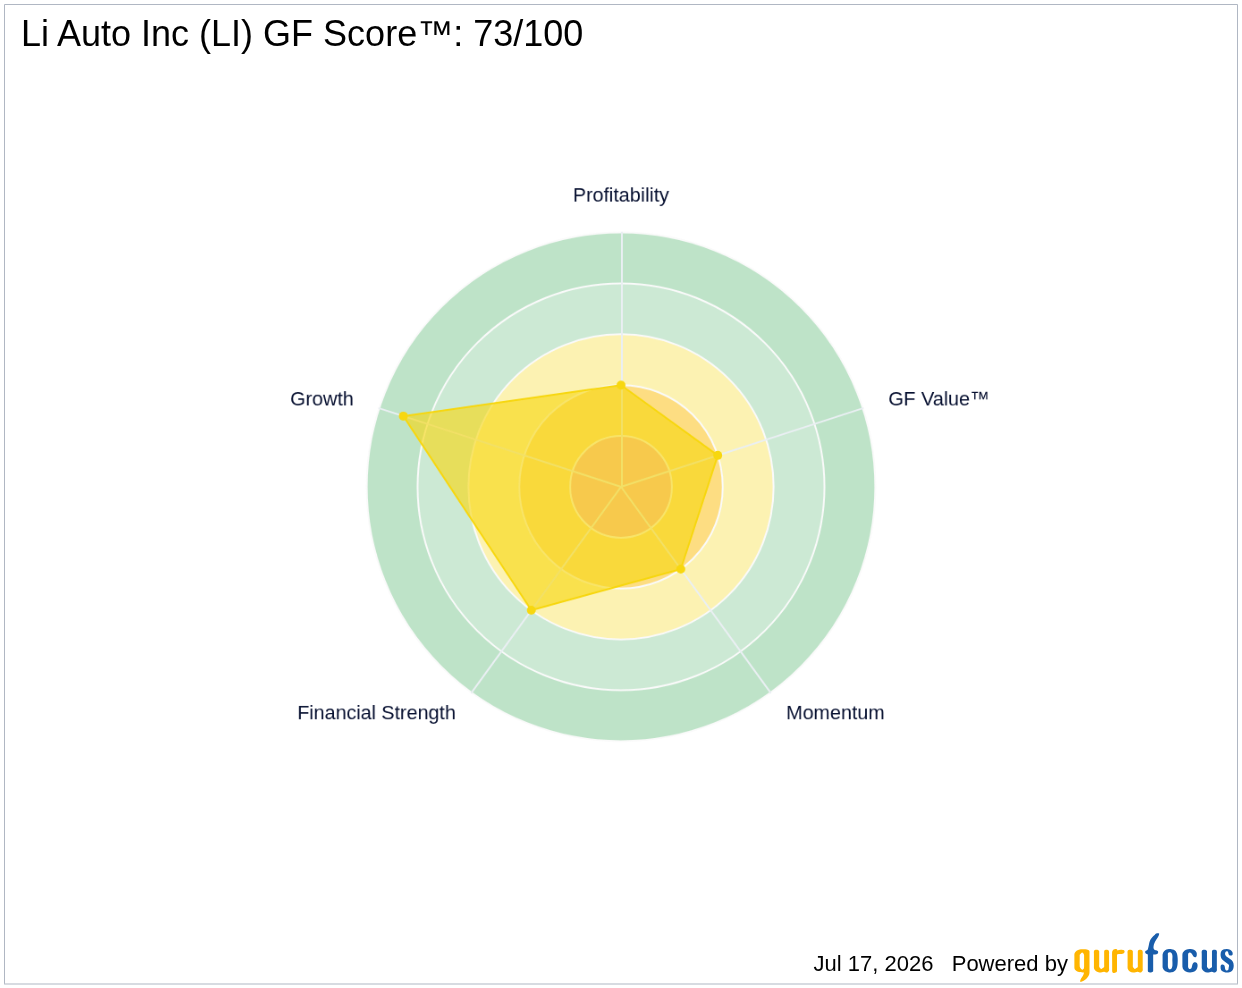
- GF Score™: With a score of 73/100, Li Auto Inc is considered above average in terms of overall quality.
- Most notable signal: There have been no insider transactions in the last three months, indicating a lack of insider confidence.
Is LI Overvalued or Undervalued?
According to the GF Value™, Li Auto Inc is currently undervalued, trading at $12.39 compared to a fair value estimate of $21.72. This indicates a substantial margin of safety of 43.0%, suggesting that the stock may present a buying opportunity for value-oriented investors. However, it is important to note that the GF Valuation label describes the stock as a possible value trap, advising caution before making investment decisions. GF Value™ is GuruFocus’ proprietary measure of intrinsic value, calculated from historical trading multiples, past business growth, and future performance estimates.
The significant discrepancy between the current market price and the estimated fair value raises questions about the underlying business fundamentals. While the price may suggest undervaluation, the label of a possible value trap indicates that factors such as growth sustainability and profitability could be putting downward pressure on the stock price.
How Does LI’s Valuation Compare to Its History?
| Metric | Current | Historical |
|---|---|---|
| P/E (TTM) | 240.3x | 26.1x |
The current forward P/E ratio of 240.3x is significantly higher than the five-year median P/E of 26.1x, indicating that the stock is trading well above its historical valuation. This analysis agrees with the GF Value™ verdict of undervaluation, suggesting that while the stock may appear cheap relative to its fair value, its current valuation multiples indicate a disconnect that warrants further investigation into its growth prospects.
What Does LI’s GF Score™ Tell Us?
| Metric | Rating |
|---|---|
| GF Score™ | 73/100 |
| Financial Strength | 6/10 |
| Profitability | 4/10 |
| Growth | 9/10 |
| Valuation | 4/10 |
| Momentum | 4/10 |
The GF Score™ of 73/100 indicates that Li Auto Inc is viewed as above average in quality. Strengths can be seen in the growth rank, which stands at 9/10, reflecting robust growth potential. However, the weakest areas are in profitability and valuation, both scoring 4/10, suggesting that while the company may be growing, its profitability metrics and valuation are not as favorable, which could be a concern for investors looking for a solid return on investment.
What Are Insiders Doing with LI Stock?
In the last three months, there have been no insider transactions reported for Li Auto Inc. This lack of activity may indicate a cautious stance from insiders, who often provide insight into the company’s outlook based on their trading behavior. The absence of buying or selling could imply that insiders are not confident in the stock’s near-term performance or may simply be waiting for clearer signals before making moves.
What This Means for Investors
Based on the analysis, Li Auto Inc is currently undervalued according to GF Value™, trading significantly below its fair value estimate. However, the high forward P/E ratio and the designation of a possible value trap indicate that potential investors should proceed with caution and conduct further due diligence.
For the complete analysis, visit the Li Auto Inc LI stock page. You can also explore the GF Value™ page for detailed valuation methodology, or use the GuruFocus Stock Screener to find similar opportunities.
Frequently Asked Questions
What is LI’s GF Score™?
LI’s GF Score™ is 73/100, indicating that it is considered above average in terms of overall quality and potential long-term returns.
Is LI overvalued or undervalued?
Li Auto Inc is currently undervalued, with a market price significantly lower than the estimated GF Value™, suggesting a 43.0% upside potential.
What is LI’s P/E ratio?
Li Auto Inc has a forward P/E ratio of 240.3x, which is much higher than its five-year median P/E of 26.1x, indicating that it is trading well above its historical valuation.
This stock alert was generated using automated technology and GuruFocus financial data to provide readers with timely and accurate market reporting. This content was reviewed by GuruFocus editorial team prior to publication. Please send any questions or comments about this story to [email protected].
